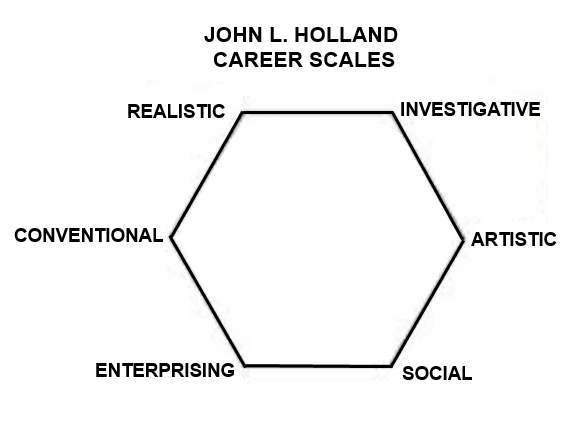
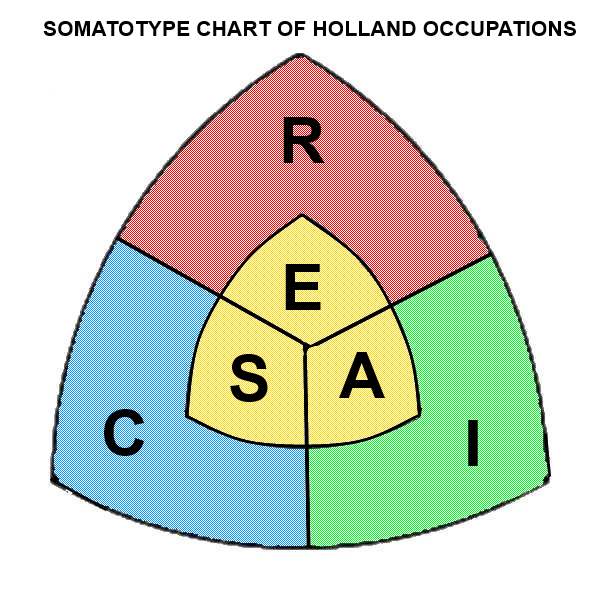
Surprise!!! People with similar personalities are attracted to the same types of jobs. Today this idea isn’t even disputed. A couple of researchers stand out in making this revealing connection. In 1927 Edward Kellog Strong developed a questionnaire focused on teasing out a person’s pattern of interests as they relate to common occupations. The purpose was to assist men coming out of the military to find suitable civilian jobs. In 1958/1959 John Holland laid the groundwork for a method of classifying personality by occupational interest. Holland identified six occupational themes along with personality traits. These themes are in wide use today. Chances are most people who graduated from high school in the 1980’s were given a report based on their occupational interests that were formatted as a large hexagon with each side representing one of the “Holland” themes. The six themes correlate with each other according to their location on the hexagon. The three highest scores are expressed as a code (referred to as Holland Codes) made up of the initial letter of the three top scores of the six dimensions. Strong’s test was married to the Holland codes changing the way career counselors guided students on the path to selecting an occupation.
Here are the descriptions of the six themes:
Realistic: Athletic- Practical- Mechanically inclined- Love nature- Operate machinery- Outdoor work- Physically active – Builders
Investigative: Curious researchers. Analytical and logical – they like scientific problems that involve precise measurements. Consider themselves intellectuals.
Artistic: Highly intuitive and original, they prefer art, music, drama, and writing.
Social: Helpers that like to work in groups on social and interpersonal problems. Teachers, therapists, and anything that gives them a chance to express themselves.
Enterprising: Sales. Persuaders, politicians and entrepreneurs. Energetic leaders.
Conventional: Prefer predictable and well-organized environments. Manage data and maintain records.
The interesting thing about the Holland Themes is that they are not superficial. The dimensions are tied to well-understood functions of the various occupations. No written test is free from the everchanging state of the person taking a test but the concrete nature of occupations lend themselves to clear choices. Evaluating one’s own emotions and behaviors seem to be more susceptible to self-censoring and socially acceptable presentation. Preference for certain occupations is something we are comfortable discussing, even as young children, which makes the process of discovering the personality implications of such choices less burdened by emotional conflict. It’s kind of a backdoor approach to understanding personality.
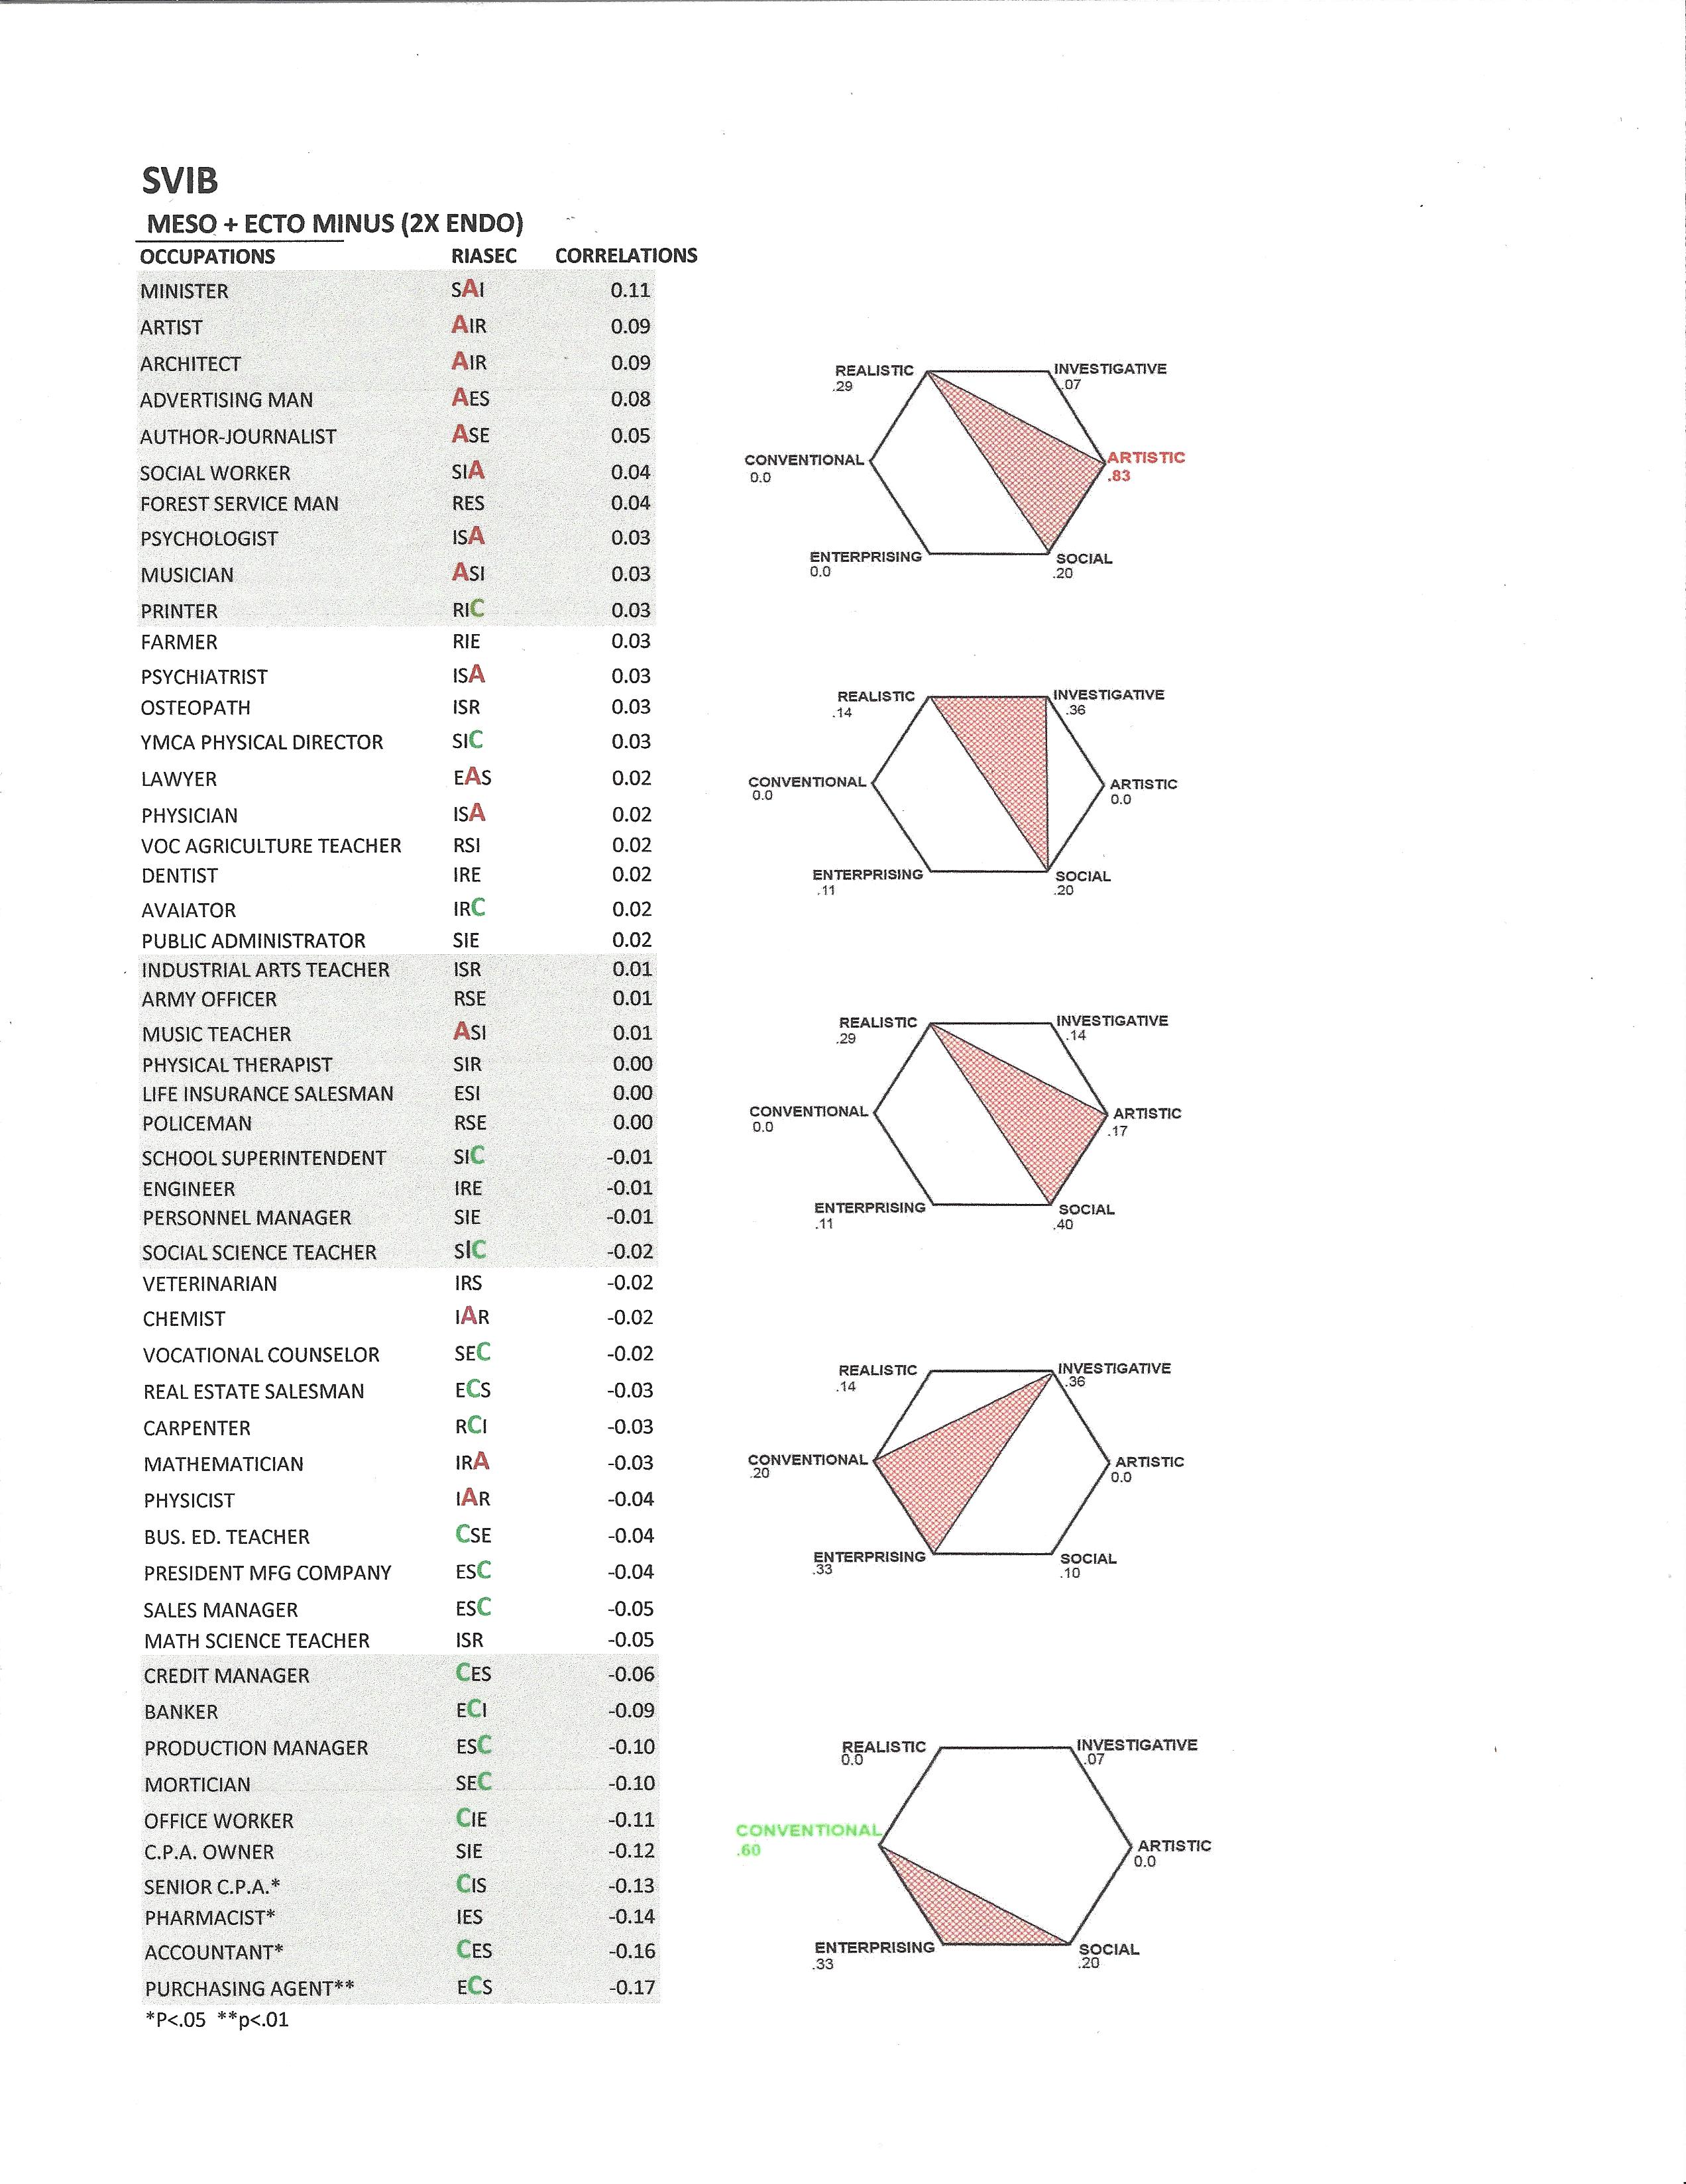
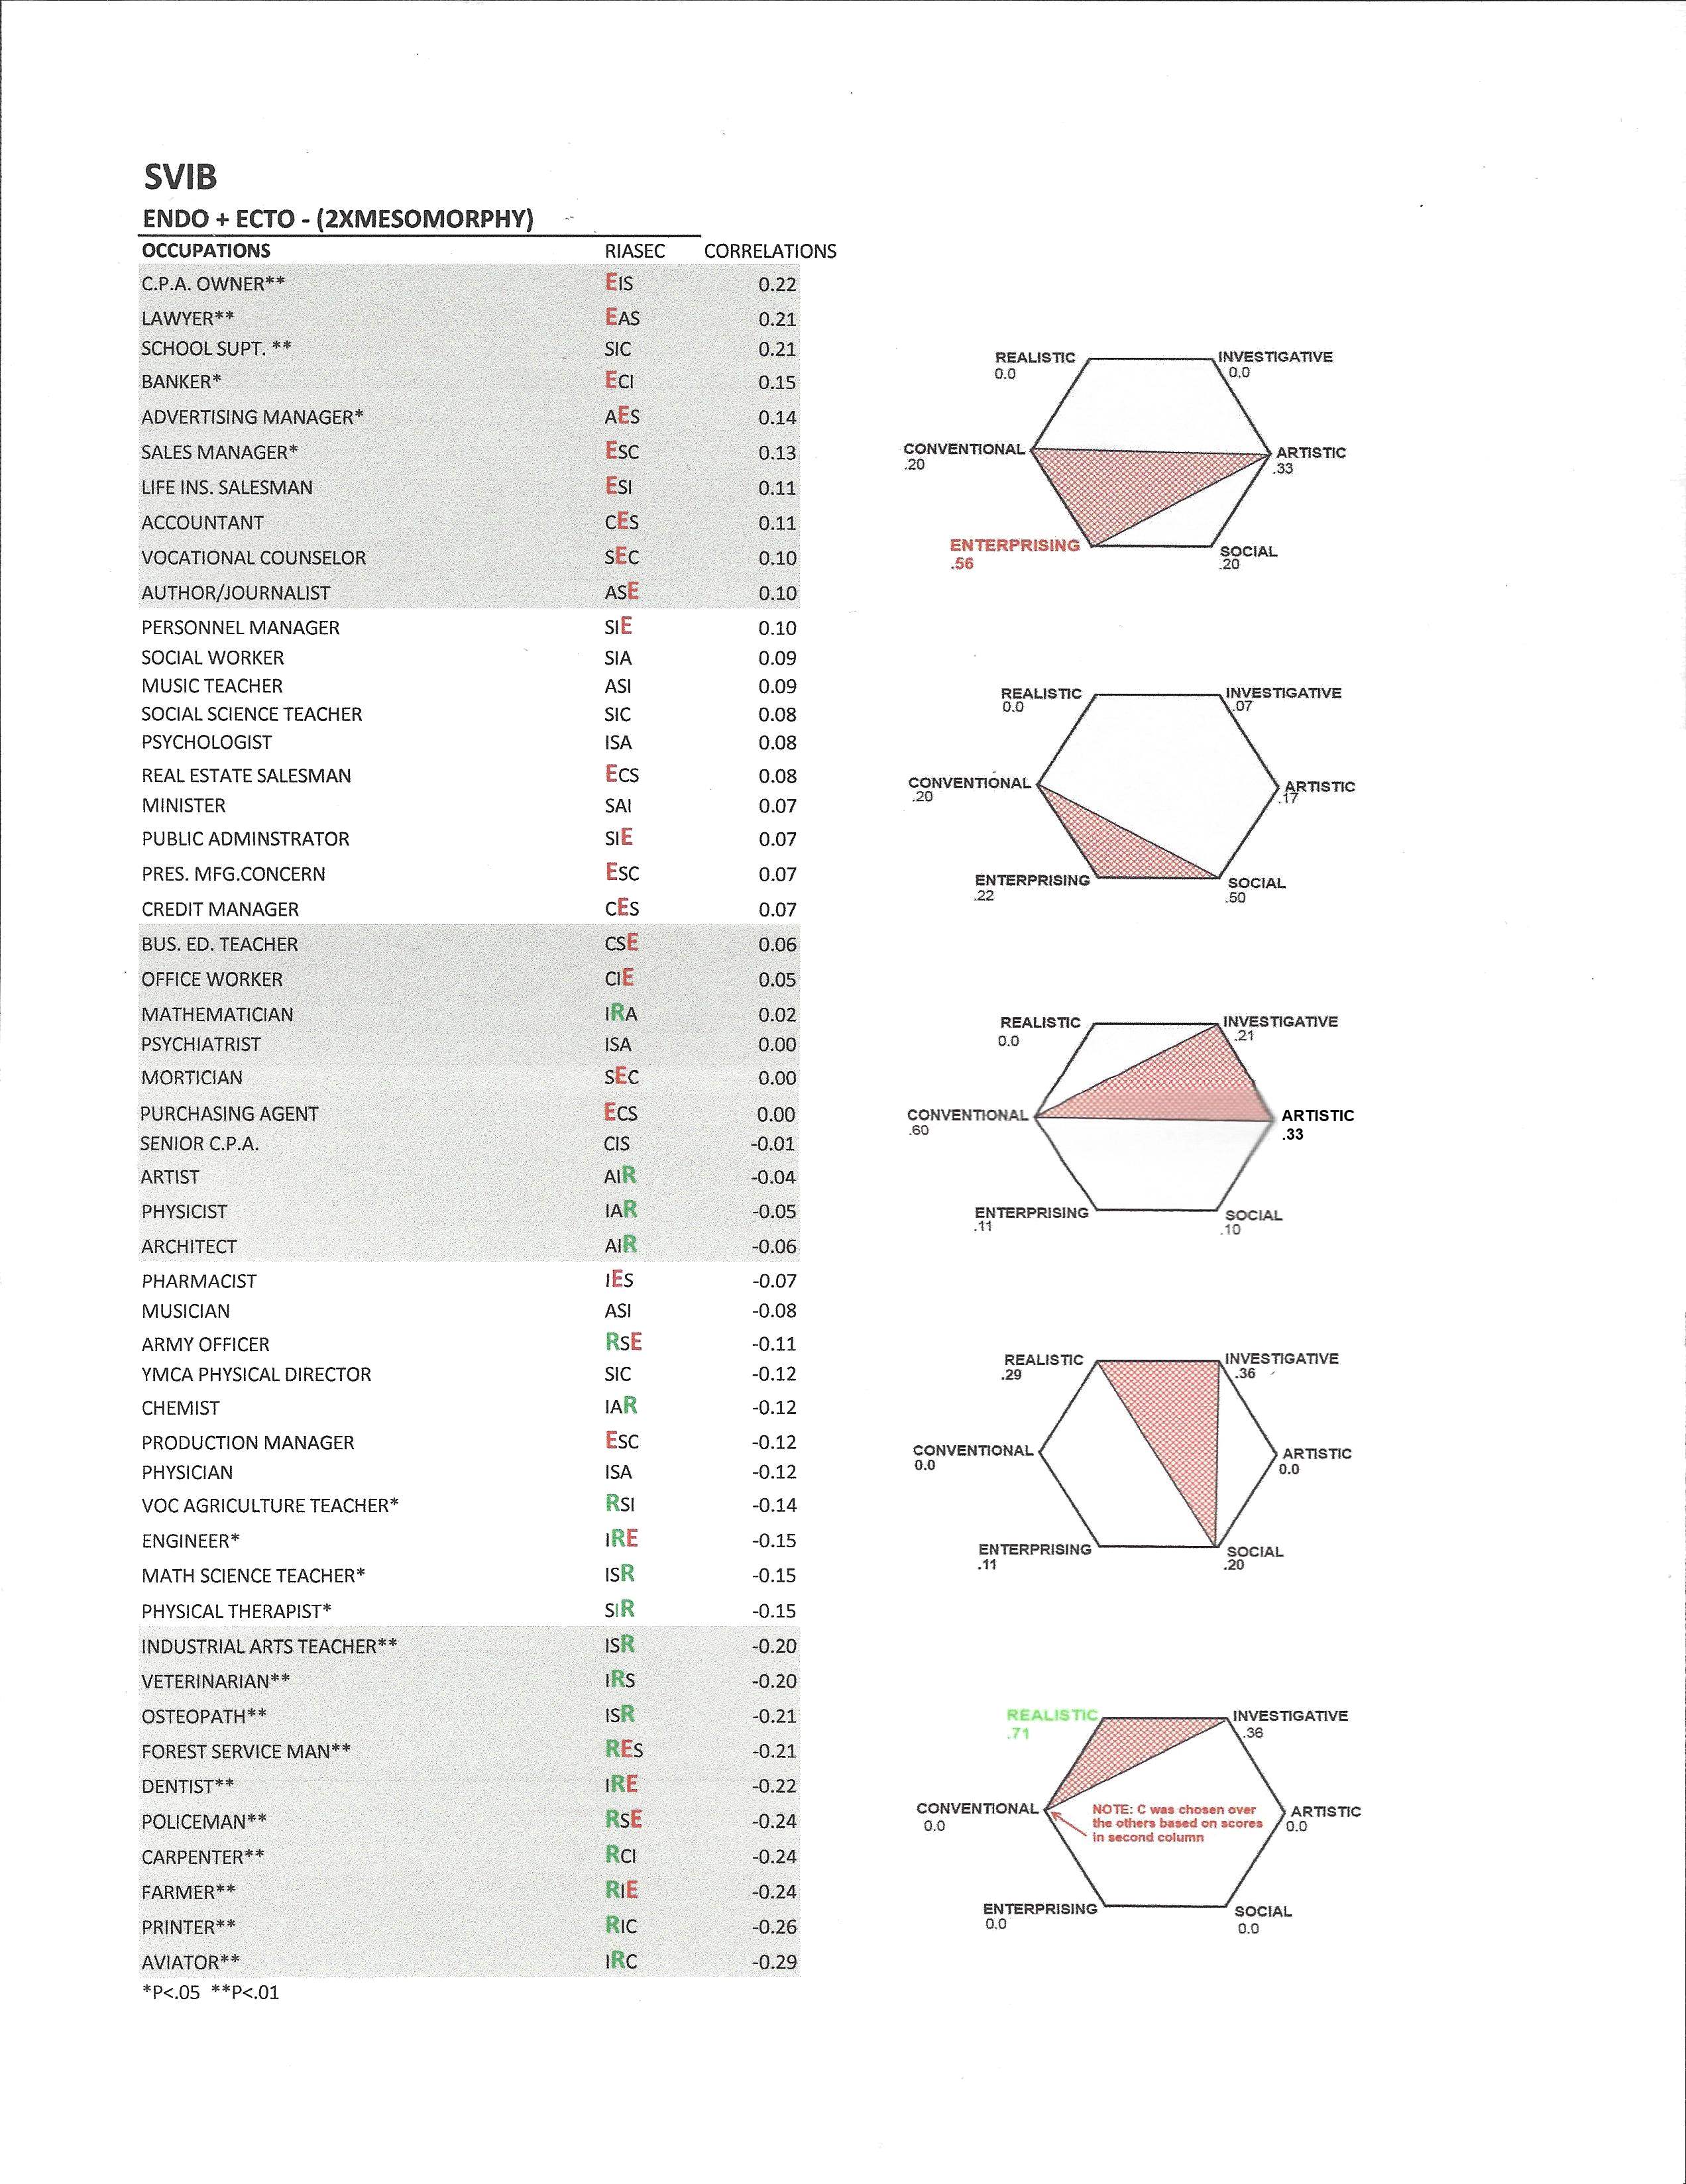
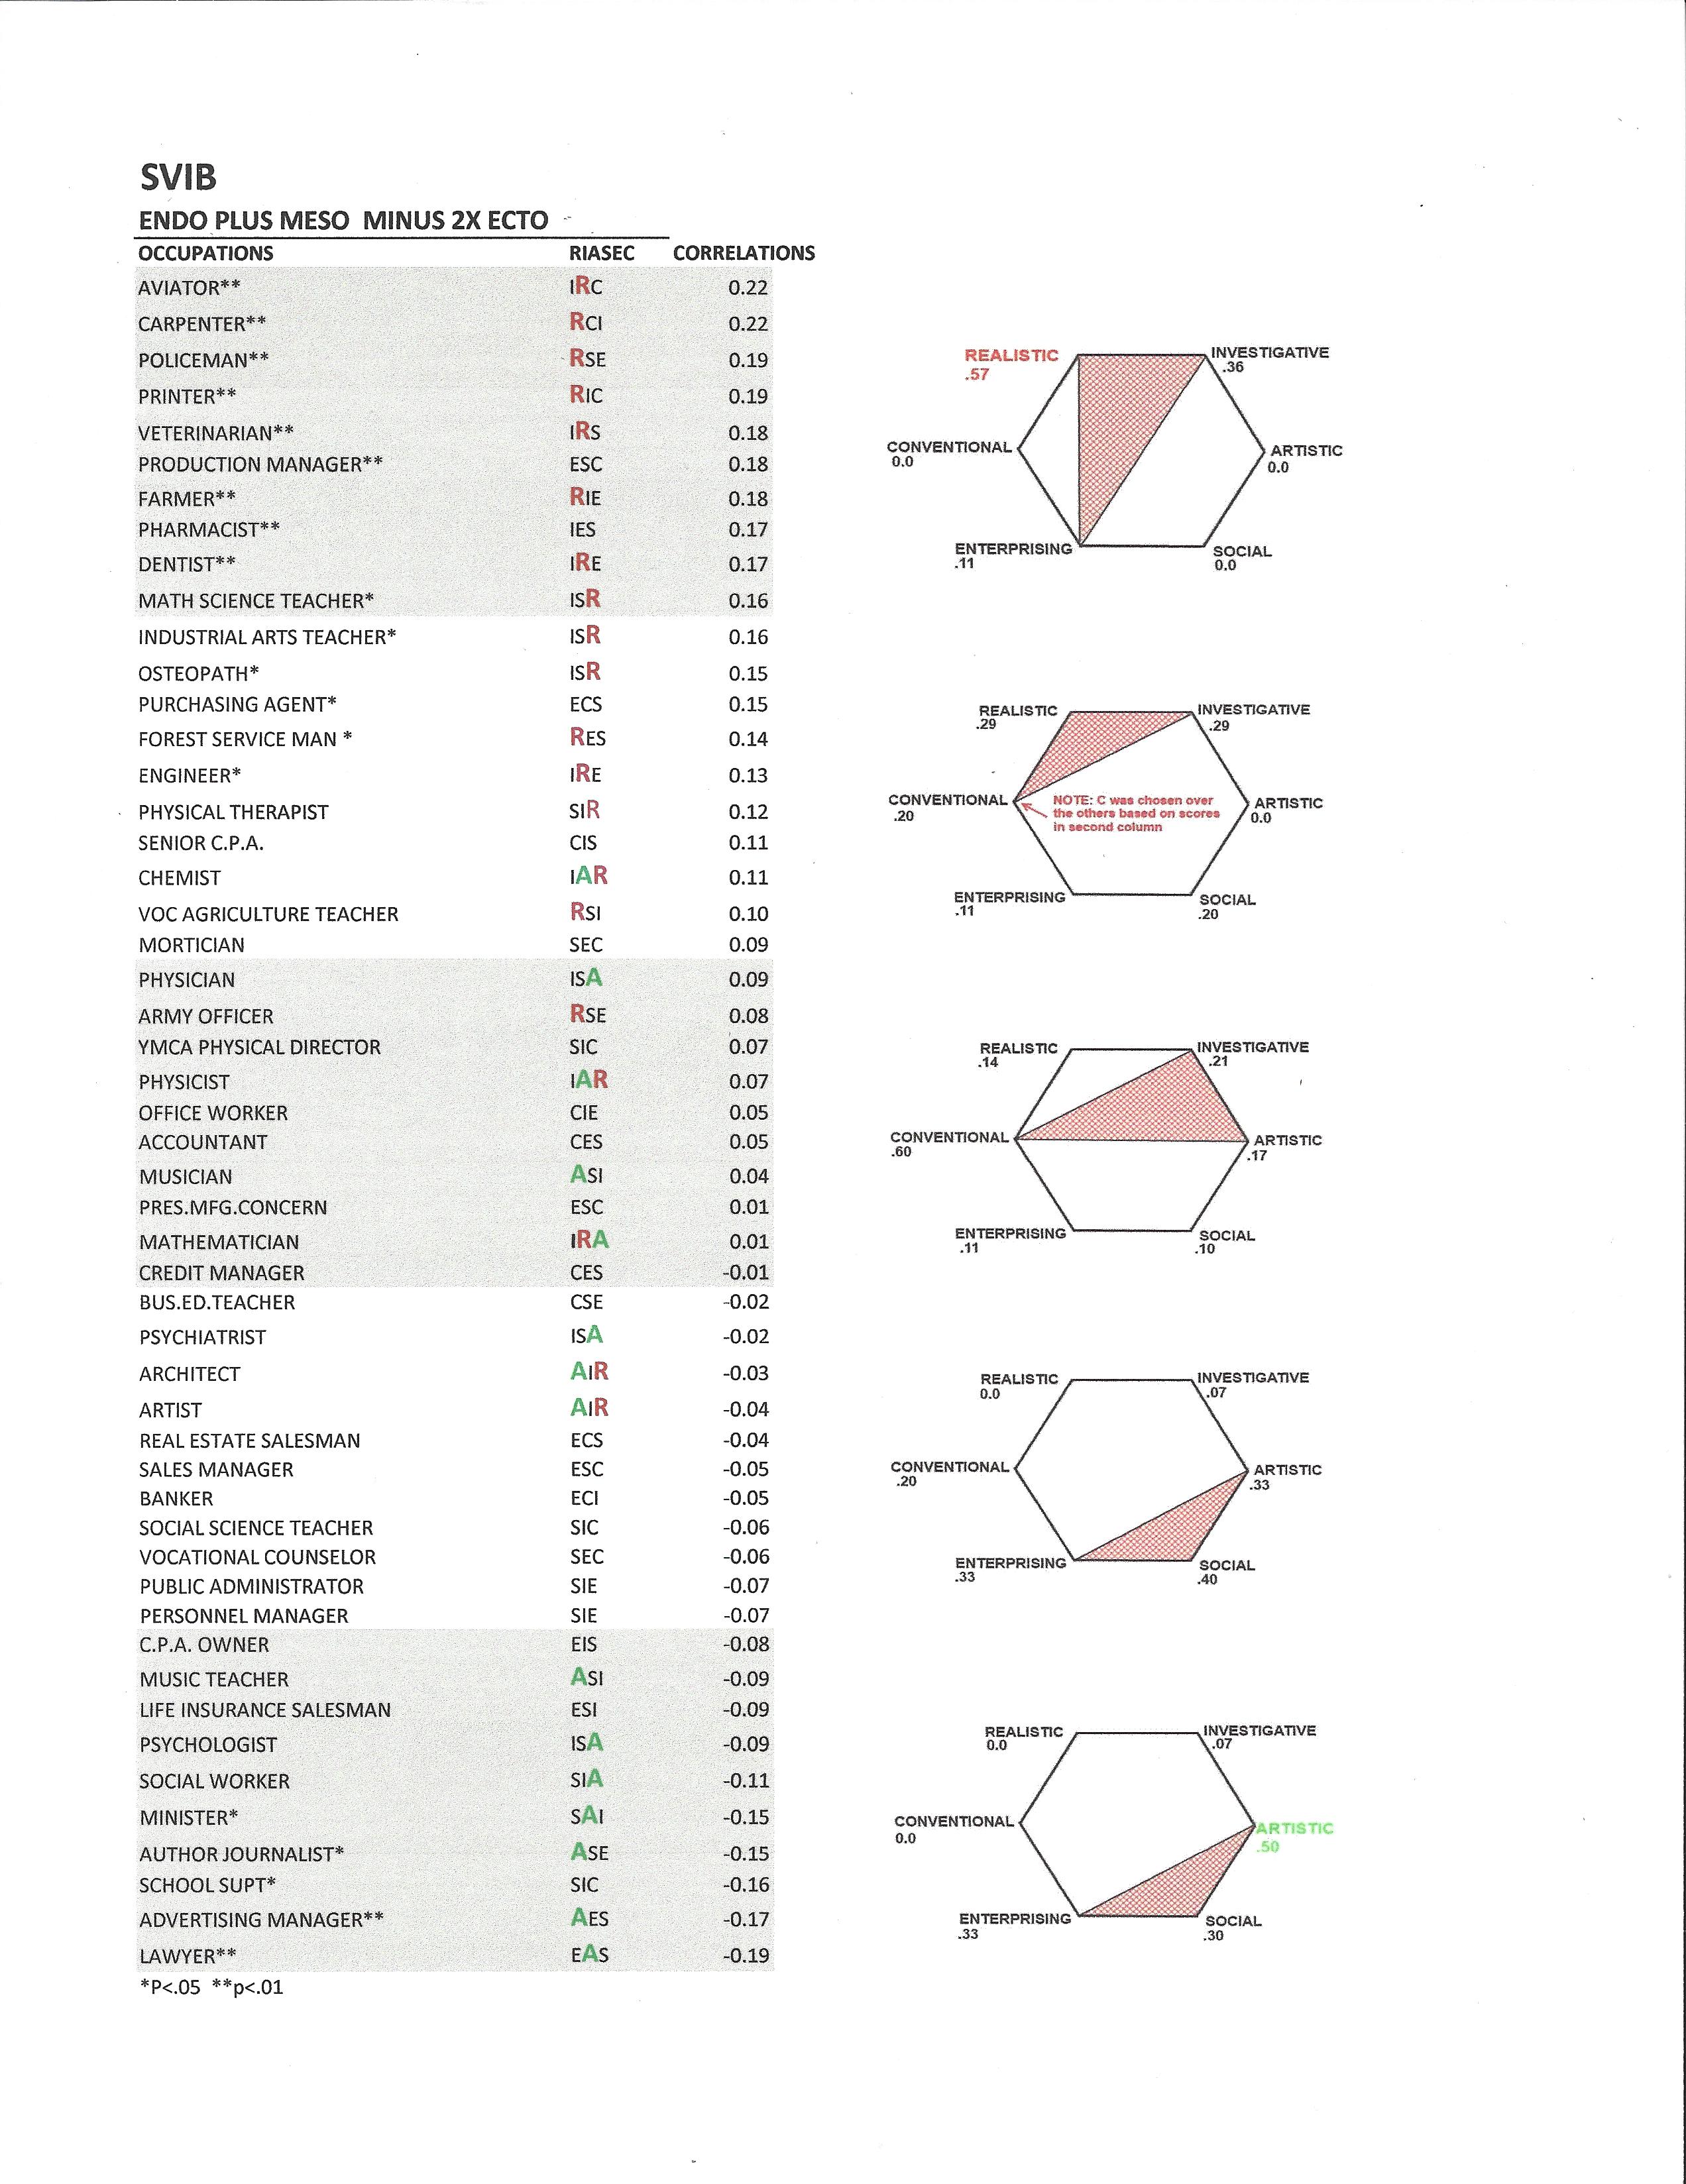
In 1988 I obtained the printouts from unpublished research that was carried out by Deabler-Damon-Dupertuis. The research (originally done in 1967) involved somatotyping 200 veterans and the results from a number of tests. (Allport-Vernon Lindzey Study of Values, Cattell 16PF, SVII -Strongs Vocational Interest Inventory) Below are some results of the Strongs Vocational Interest Inventory. I added the official Holland Codes for the various occupations and sorted the results to obtain the rank order for the correlations between somatotype and occupational interest.
The researchers used many combinations of somatotype scores. Here are some of the scales they used:
- Component Sum = Endomorphy + Mesomorphy + Ectomorphy
- Endomorphy + Ectomorphy
- Endomorphy + Mesomorphy
- Mesomorphy + Ectomorphy
- Endomorphy – Mesomorphy
- Endomorphy High Gynic
- Etc.
For this post I chose the results from the following configurations:
- Mesomorphy + Ectomorphy – 2X Endomorphy
- Endomorphy + Ectomorphy – 2X Mesomorphy
- Endomorphy + Mesomorphy – 2X Ectomorphy
In each case, I added the 3 letter Holland code for the various occupational interests. Next, I sorted the correlations in a rank order from highest to lowest. To understand the significance of the results I divided the table of rankings into 5 sections. My purpose was to see how the Holland codes sorted out in the descending rank of the 5 sections. There is a little data massaging (weighing) that had to be done because some of the Holland codes had a higher representation over-all than others. So I assigned a numerical amount that would express the percentage of the total for each of the Holland areas that appeared in each section.
I focused on the dominant letter of the three letter code. I figured that the dominant was more significant (50%) than the other 2 letters of the code. Here is the count of each of the Holland Themes that are dominant in the list of three-letter Holland codes.
- Realistic = 7 Each R in the dominance list would be assigned a value of .14
- Investigative = 14 Each I in the dominance list would be assigned a value of .07
- Artistic = 6 Each A in the dominance list would be assigned a value of .17
- Social = 10 Each S in the dominance list would be assigned a value of .10
- Enterprising = 9 Each E in the dominance list would be assigned a value of .11
- Conventional = 5 Each C in the dominance list would be assigned a value of .20
As you look at the three charts that follow note the dominant Holland Theme at the top of each list. Next look at the dominant Holland Class at the bottom of the list. Next look at how the list sorts out in each of the five divisions. You can get some insight by looking at the Hexagonal Chart listed to the right of each division. The red sections of the Hexagonal Charts represent the space occupied by the Holland Theme for that section. The highest and lowest Holland Theme on each of the three charts is marked. They show a clear relationship between somatotype and occupational interest. This simultaneously supports Hollands Chart and Sheldon’s somatotype scheme.
NOTE: You may want to enlarge these charts for readability. To do this press [ctrl] and “+” key together.
